
Dear Karim and all,
I’m having some troubles in exporting the 3dc object in the gnuplot patch found in the OMScoreTools tutorials.
With the bpf-lib everything seems working:
gnuplotbpfs.pdf (10.4 KB)
But when I try to save the 3dc the file cannot be opened because, as the Mac finder says, “it is damaged”. I’m on MacBook Air 15’’, M4, 2025 with OS Sequoia, and this the text coming from the OM listener:
:: cd “/Users/francescobernardovitale/Desktop/”; sh -c ‘"/usr/local/bin/gnuplot" “/Users/francescobernardovitale/Desktop/gnuplot3dc”’
:: qt.qpa.fonts: Populating font family aliases took 54 ms. Replace uses of missing font family “Sans” with one that exists to avoid this cost.
:: Hit any key to continue
OM => 0
I don’t really know what it means. Is there a way to fix the library in order to print not only 3dcs, but also 3dc-libs? Thanks in advance for all,
Best,
Francesco
Hi francesco.
This is not a OM problem, but a mac/gnuplot issue on mac:
When outputing a 3d plot, there is no pdf produced. Just the .gp file (the gnuplot file).
- when you evalutae the output of om->gnuplot, name the output something like 3d.gp
- then go to a terminal and open this fie using this command:
gnuplot 3d.gp
This will display the graphical interface of gnuplot and then you can visualize it in 3d.
I will try to find something around this for mac in order to open it automatically.
Best
Regards
K
Dear Karim,
with the command you gave me, everything works as it should. There’s only one problem left unsolved: if I use as an input a list of 3dcs, or simply a 3dc-lib, the curves aren’t written in a single .gp file, but in multiple files, each one for a different curve. Why isn’t it possible to save more than one 3d curve? Is it a gnuplot or an OM issue?Thanks again for all.
Best,
Francesco
No This is not an issue but a limitation.
I don’t think that gnuplot can visualize multiple planes at the same time.
If you find an example that does this please felle free to inform me.
Best
K
Dear Karim,
I’m not familiar with gnuplot, but as an example of multiple 3d curves rendered in a single file I found on the internet this image (taken from this webpage https://stackoverflow.com/questions/47510797/gnuplot-how-to-connect-points-with-multiple-lines-in-3d-from-a-file):
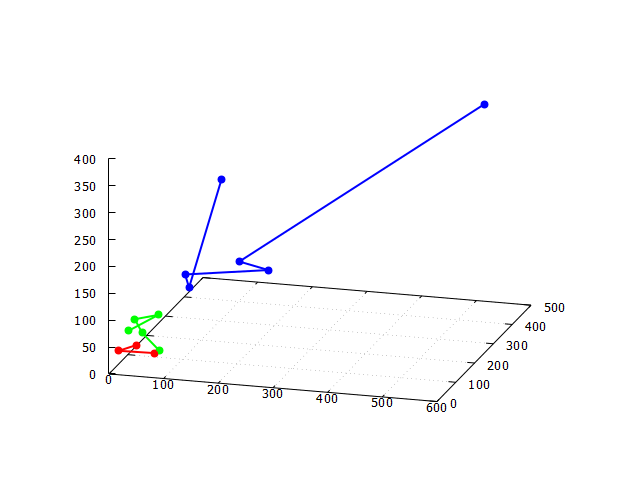
That would be the result I expected to get when exporting a 3dc-lib in gnuplot. Let me know if you find a solution. All the best,
Francesco
Yes this seems not working. Gnuplot as mentioned in the post above is not good at sorting multiple 3d curves. It seems to me too much trouble for what its worth. So for the time being let us say we leave it that way, and devise a better solution.
And mind me asking, for what purpose do you need this visualization?
Best
K
Dear Karim,
first of all, thanks for your effort. I needed the gnuplot visualization for one main reason: the background 3d grid with the numerical values. This is a very useful feature that I wanted to have to get printed much more informations about the plotted curves. Thanks again.
Best,
Francesco
Dear Francesco,
Ok i will see what I can do. Will get back to you after examining what we can do in gnuplot. From the OM side it is no big deal, just writing a new method for 3dlib. The sorting can be done very easily in OM. The big deal is how gnuplot handles this. Apparently the code in the post above is not working for me. Did you try it?
Best
K
Dear Karim,
I haven’t been able to get that code working in gnuplot, but as I said I’m not much familiar with it, so maybe I’m doing something wrong. I’m looking for different examples, to see if they work better.
Best,
Francesco
Ok figured it out. this will work:
#set terminal pdf #outputs svg but doesn't display
#set output  "d1_plot.pdf"


set ticslevel 0

$data1 << EOD
13  14  39
19  90  23
54  87  12
EOD

$data2 << EOD
54  87  12
78  40  36
10  76  54
64  76  88
19  82  74
30  89  47
EOD

$data3 << EOD
103 298 263
111 103 133
215 222 132
175 184 158
102 108 155
530 456 384
EOD

splot \
$data1 u 1:2:3 title "3DC" with lines lt rgb "#50D140", \
$data2 u 1:2:3 title "3DC" with lines lt rgb "#CB0DF6", \
$data3 u 1:2:3 title "3DC" with lines lt rgb "#2360E3"

pause -1 "Hit any key to continue"
Now i can write the method ![]()
I have still an issue with opengl on linux, but will see what i can do.
Will keep you informed.
BEst
K
Dear Franceso,
I have commited the method into the libraries code.
Now you can test it from here:
Didn’t yet make a release for this lib so you just have to download the code.
Keep me informed.
Best
K
Dear Karim,
many, many thanks for this updated code. I tried a few times to save a 3dc-lib with write-gnuplot-3dlib file, but when I load the file in gnuplot I always get this error:
francescobernardovitale@MacBook-Air-di-Francesco ~ % gnuplot /Users/francescobernardovitale/Desktop/3dlib
“/Users/francescobernardovitale/Desktop/3dlib” line 8: no datablock named $data1
I attach here the patch and the resulting .gp file
3dlib.gp (187 Bytes)
05-gnuplot.omp (6.7 KB)
Best,
Francesco
Ok! It’s fine now. Great work Karim, as usual.
All the best,
Francesco