< Back to IRCAM Forum

OM laggy with larger datasets

When working with larger datasets OM becomes very laggy and almost unresponsive. I’m not talking about huge datasets - just 500,000 numbers.

Is there a way to increase the memory that OM has available to it, or increase a cache somewhere to improve it? Or am I abusing the intended use?

Thanks!

Dear Graham,

Can you be more precise about these datasets? i.e in what particular context you are calling them. Better, can you send me an example so i can precisely see how we can optimize this.

Best
K

Hi Karim -

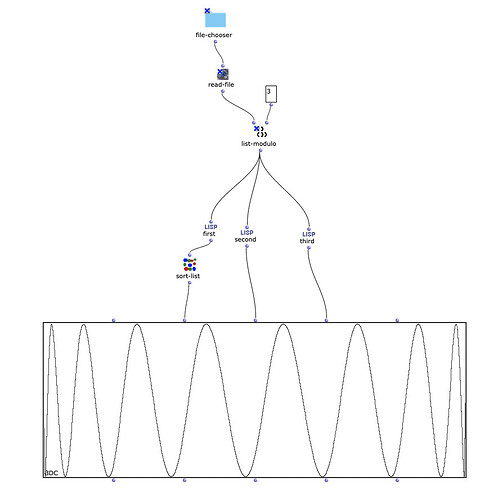
Thanks for looking into it. All I’m doing so far is reading in a space-delimited file of xyz data (CSV doesn’t work so I’ve converted to space delimited in Excel) and then plotting it on a 3DC. This is just the beginning of what I’d like to do, but OM becomes very laggy once this data is read in.

Here’s the patch and attached is the data file. Thanks!

Graham

xyz_data.prn (1.1 MB)

Dear Graham,

Ok, the problem comes from the 3dc representation. You have too much points that the editor can handle easily. In order to bypass the “laggyshness” of it all:

  1. Don’t use the miniview on the 3dc
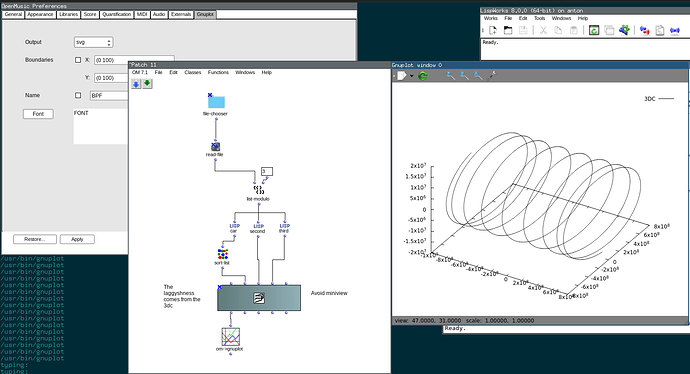
  2. instead of using the 3dc editor (opened editor), you can still display, and better print out your 3d graph using gnuplot (free ploting app). You have the OMScoreTools library that exports all bpf, bpc and 3dc as plots:
    GitHub - openmusic-project/OMScoreTools: Interaction between OpenMusic's score objects and curves/functions objects.
    For the 3dc you must set svg output and then choose in Gnuplot your selected 3d view, then you can optionally print it in any format you choose.

Here is the patch WITHOUT the data file:
Patch 11.omp (2.2 MB)

Best
K

Ooh - wow - thanks Karim! I’ll try that. Amazing!

Hi Karim - thanks again - simply not having mini view enabled solves the laggishness.

I did try the gnuplot viewer too. However, for some reason it only works for me in 2D.

If I execute om->gnuplot with a 2D BPF, then it creates an SVG nicely and console output is:

:: cd "/Volumes/PROJECTS/2022/PLANETS/DATA/Test files/"; sh -c '"/usr/local/Cellar/gnuplot/5.4.3_1/bin/gnuplot" "/Volumes/PROJECTS/2022/PLANETS/DATA/Test files/test_gnu_plot"'
:: 
:: 	Rectangular grid drawn at x y tics
:: 	Major grid drawn with lt 0 linecolor 0 linewidth 0.500
:: 	Minor grid drawn with lt 0 linecolor 0 linewidth 0.500
:: 	Grid drawn at default layer
:: 
OM => 0

But if I try to run it with a 3DC input the unix executable file gets created but no SVG - although the plot does momentarily pop up on the screen before disappearing without writing the SVG - and a console output of:

:: cd "/Volumes/PROJECTS/2022/PLANETS/DATA/Test files/"; sh -c '"/usr/local/Cellar/gnuplot/5.4.3_1/bin/gnuplot" "/Volumes/PROJECTS/2022/PLANETS/DATA/Test files/test_gnu_plot"'
:: qt.qpa.fonts: Populating font family aliases took 239 ms. Replace uses of missing font family "Sans" with one that exists to avoid this cost. 
:: Hit any key to continue
OM => 0

I installed gnuplot via Homebrew and the version looks like it is 5.4.3_1 and I’m on OM7.0 on MacOS 12.4.

Thanks Karim!

Dear Graham,

Tried here on a mac M1 (gnuplot homebrew), same result. Unfortunately, it appears it is related to the homebrew gnuplot version. On Linux this runs fine. So, unfortunately, you should for the moment run the gnuplot command in a terminal and open your fgenerated .gp file. there you will be able to select the desired rotation of your 3d figure, then print it out. I will try to find a more elegant way for the mac version.

Best
K

Thank you Karim!