Hello,
Is there a way to measure the evaluation duration in OM (from the moment when the v key is pressed until the ‘Ready’ message appears in the om Listener)?
best
rc

Hello,
Is there a way to measure the evaluation duration in OM (from the moment when the v key is pressed until the ‘Ready’ message appears in the om Listener)?
best
rc
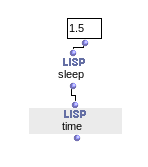
If you can add the 'time macro at the bottom, OM will print some stats:
great. thanks for the hint!!! ![]()
in the OM Listener i get:
User time = 1.896
System time = 0.043
Elapsed time = 1.924
Allocation = 2251618792 bytes
0 Page faults
Calls to %EVAL 22044028
GC time = 0.162
I assume that the User System and Elapsed time are in seconds. What are the other stats? is there a way to make them ‘human’ readable?
Another thing: if I close and reopen the OM Listener the time macros stops giving stats. Instead it throws OM => nil
Is there a way to make it work again after reopening the listener?
best
rc
You may read the full CL docs here: Common Lisp HyperSpec (TM)
Has it the 'time macro returns the value you feed it with, only printing the stats as a side-effect (to the 'trace output-stream, whatever that may be set to).
Not sure why closing and opening the listener changes the behavior? Possibly a bug? E.g. that *trace-output* isnt (re)set to print its output to OMs listener?
thanks for your reply!
the hyperspecs says " The nature and format of the printed information is implementation-defined. Implementations are encouraged to provide such information as elapsed real time, machine run time, and storage management statistics."
What is the meaning of Allocation, Page faults, Calls to %EVAL and GC time and their values?
I don’t know if it’s a bug or feature but i would like to know how to get the time macros stats again after reopening the listener. Is it possible somehow?
best
rc
The macro time can be used to determine execution times. The macro evaluates the form form and returns its values values. time also prints some timing and size data: user time, system time, elapsed time, and the total amount of heap space allocated in executing the form (in bytes).
The user time printed is the time used by LispWorks or any code that it calls in a dynamic library.
The system time printed is the time used in the operating system kernel when it is doing work on behalf of the LispWorks process.
The elapsed time printed is the time you could in principle measure with a stopwatch.
If LispWorks is 100% busy throughout the execution of the code, then user time + system time ~= elapsed time.
Each of the times is printed as:
The timing and size data covers all stack groups, not just the one that invokes time.
vs the trace-output isn’t updated to point to the new Listener pane after closing+opening, i beleive thats a bug. Thanks for catching that!
I’ll look into that, but unfortunately no time before end of next week, too busy using some nice sunny no-hack-weather atm ![]()
thanks for the info!!!