< Back to IRCAM Forum

Imubu high-resolution spectrogram

Does anyone know how to use imubu to display a high-resolution spectrogram of a mubu buffer?

I need something like the classic RX, Audition, Audiosculpt style spectrogram inside a Max patch and would ideally do it without going down the custom jitter path…

mubu.process with slice:fft and the proper high-resolution settings?

Hi @schwarz - do you have an example of this? What would be an example high-resolution settings?

I haven’t been able to find much documentation of this so I’m just using trial and error to adjust the parameters into mubu.process.

So far, using mel bands seems like the right direction but if I try and increase the resolution the display doesn’t work or Max crashes. I’m using small hop sizes and lots of bands which could be causing issues.

If you have any example parameters or patches that display a high-resolution spectrogram, it would be great to see it. The mubu.process reference page doesn’t have any info on FFT parameters or slice:fft

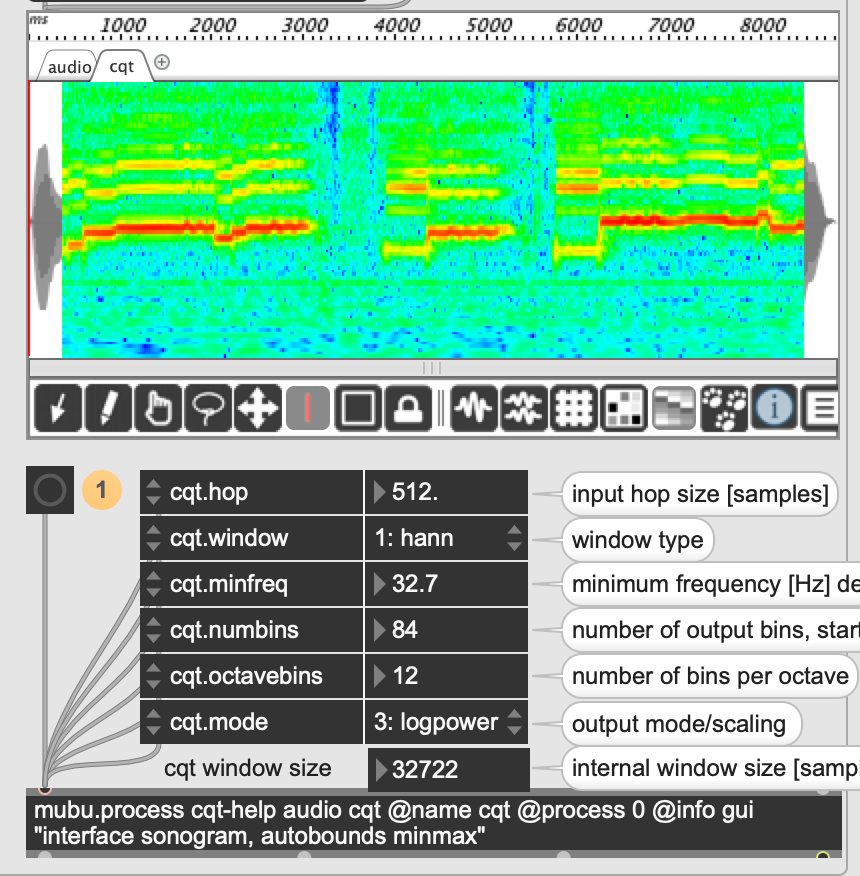
Update: the closest thing to the log spectrogram I need seems to be the pipo.cqt module but I can’t find much info on it.

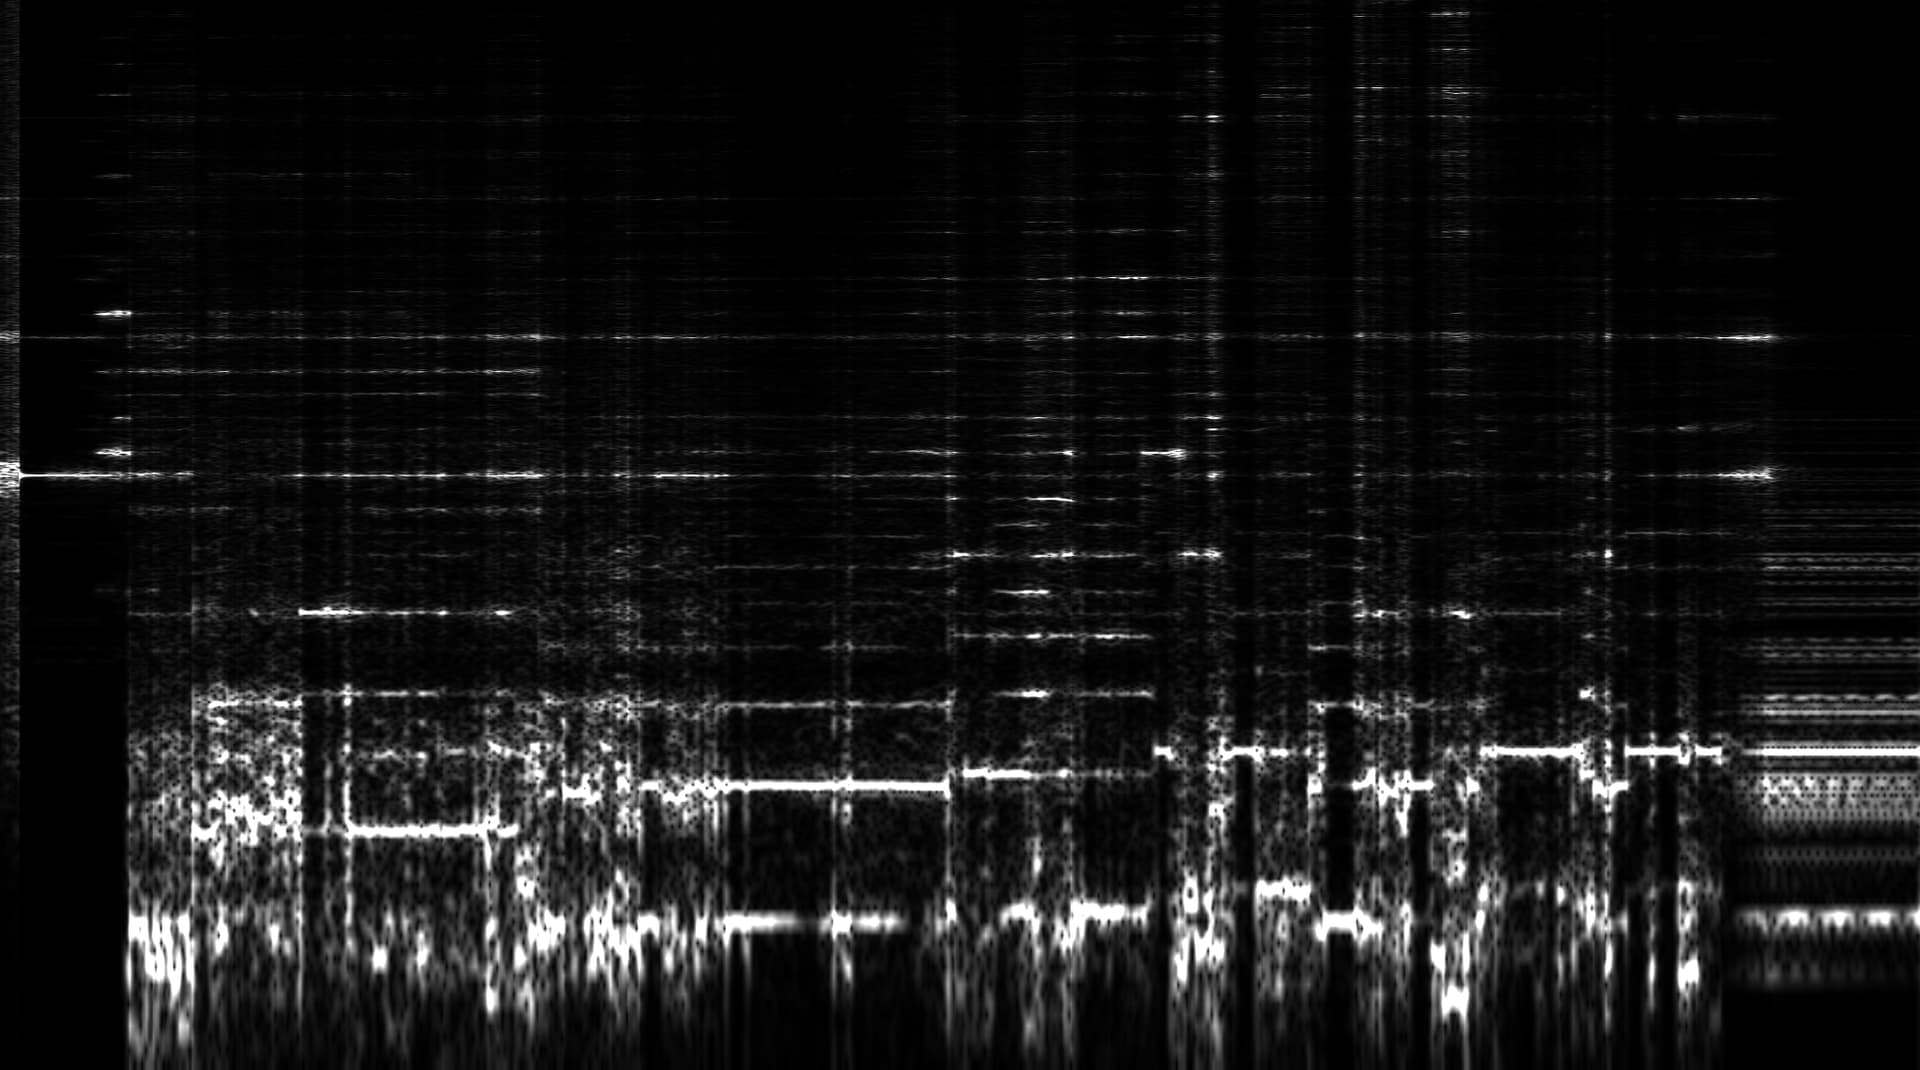
Is there a way to fix the display so it isn’t offset from the audio waveform display (screenshot below) ? And is it possible for this to display a high-resolution spectrogram similar to RX?

Hi srs, look at the pipo.catalog for modules’ docs. Time resolution would be given by @slice.hop, freq. resolution by @slice.size (look up the parameter values in RX). @fft.mode logpower gives a good amplitude view. mel and cqt warp the frequency axis and won’t give a “neutral” spectrogram.
Best

Hi Srs,
can you give us an example (patch + date) that reproduces the crash?
Thanks

Thanks @schwarz I’ve been experimenting with these and getting close to what I need. I do want to warp the spectrogram to look as logarithmic as possible (similar to Extended Log in RX or the Log view in Sonic Visualiser). Is that kind of fully logarithmic spectrogram possible with any pipo modules used with mubu.process?

I’m aiming for something like this and currently the only workaround is to just display a PNG screenshot of Sonic Visualiser using an [fpic] object

Hi @borghesi - I’m using the example patches from the pipo.catalog and I think I was just entering strange fft.size, slice.hop and slice.size parameters in a trial-and-error approach to get the highest quality spectrogram possible.

If you have any example patches that you think produce the best imubu spectrogram results, that would be great as I think I may have hit the limit of what is possible and haven’t got even close to the quality of the screenshot posted above…

hi srs,
here a version of mubu that should fix the scroll bug and the crash that you reported :

About the display you could try with “colormode fgcolor” (which interpolates between foreground and background colors), and try to adjust the display with the message "“view name/index paramdisplayrange color min max”.
Unfortunately, the sonogram interface is not very optimised, so I suggest that if you want to use it in real time, you reduce the size of imubu and decrease the refreshrate.
I hope this helps,
Best

In order to adapt the displayrange, however, you must deactivate autobounds, which I see is used in your patch by mubu.process to create the output track.