< Back to IRCAM Forum

FFT - Sonogram Analysis

Hello,

I was trying to analyze a double bass tremolo sound in Partiels and I encountered some values that I couldn’t understand. I hope you could help me.
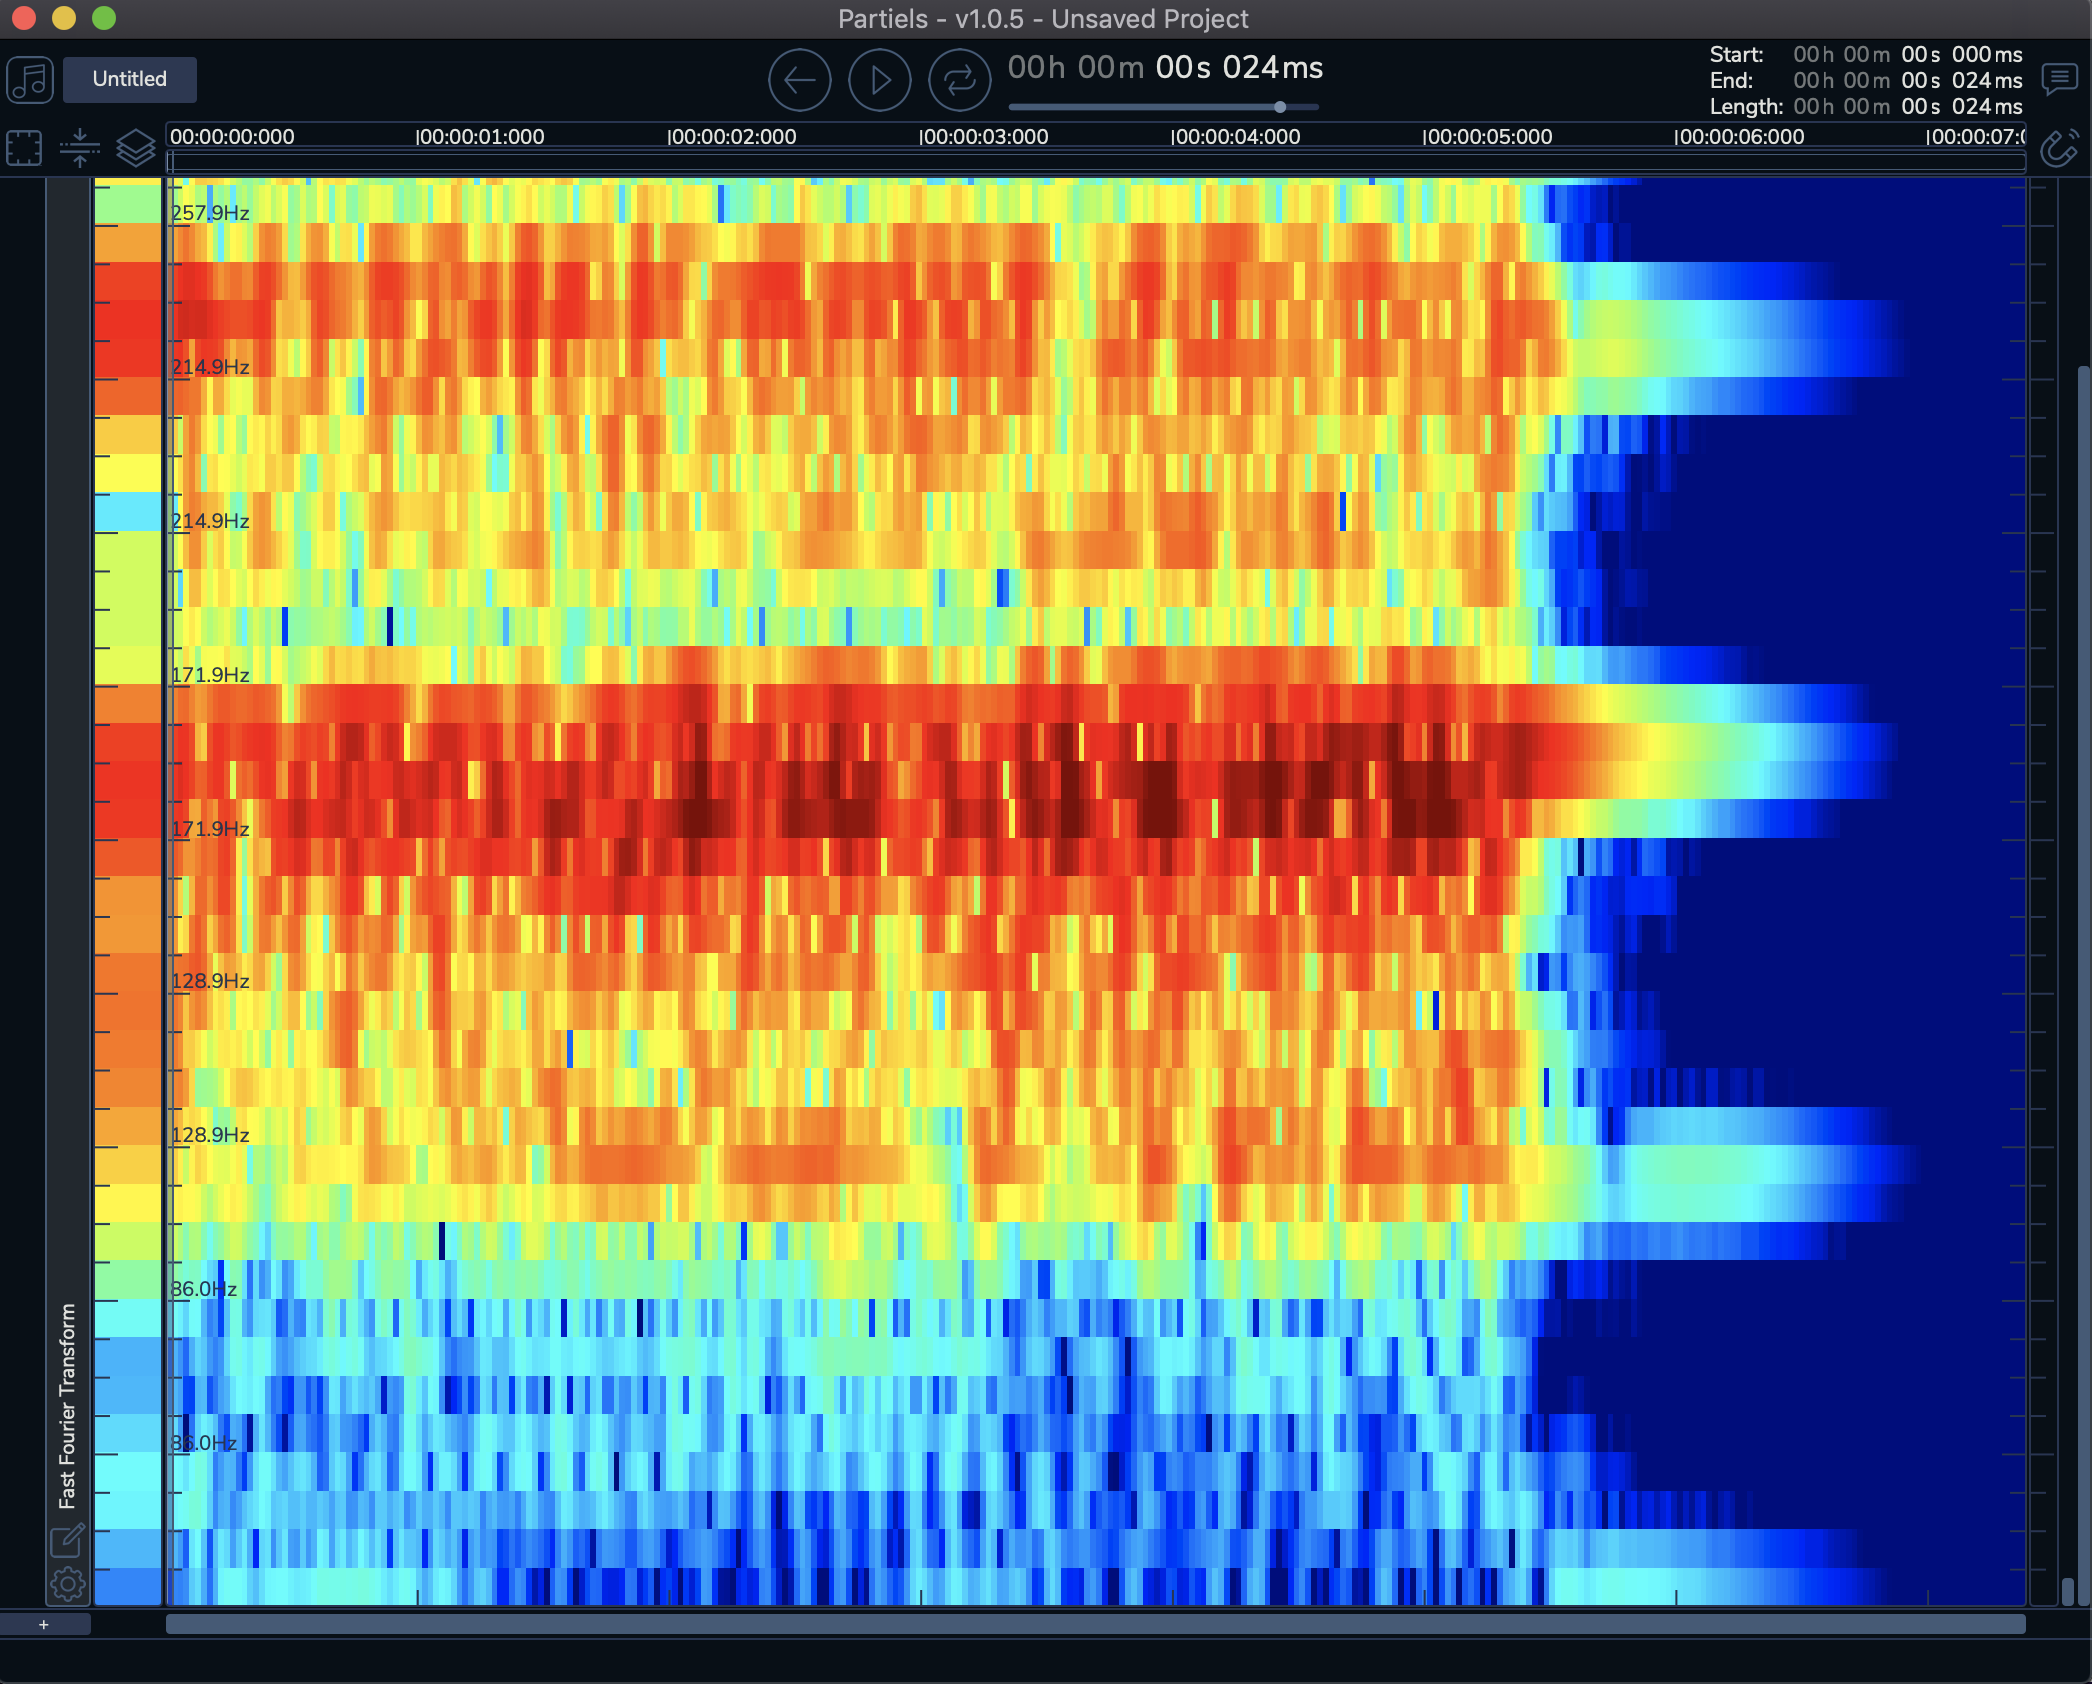
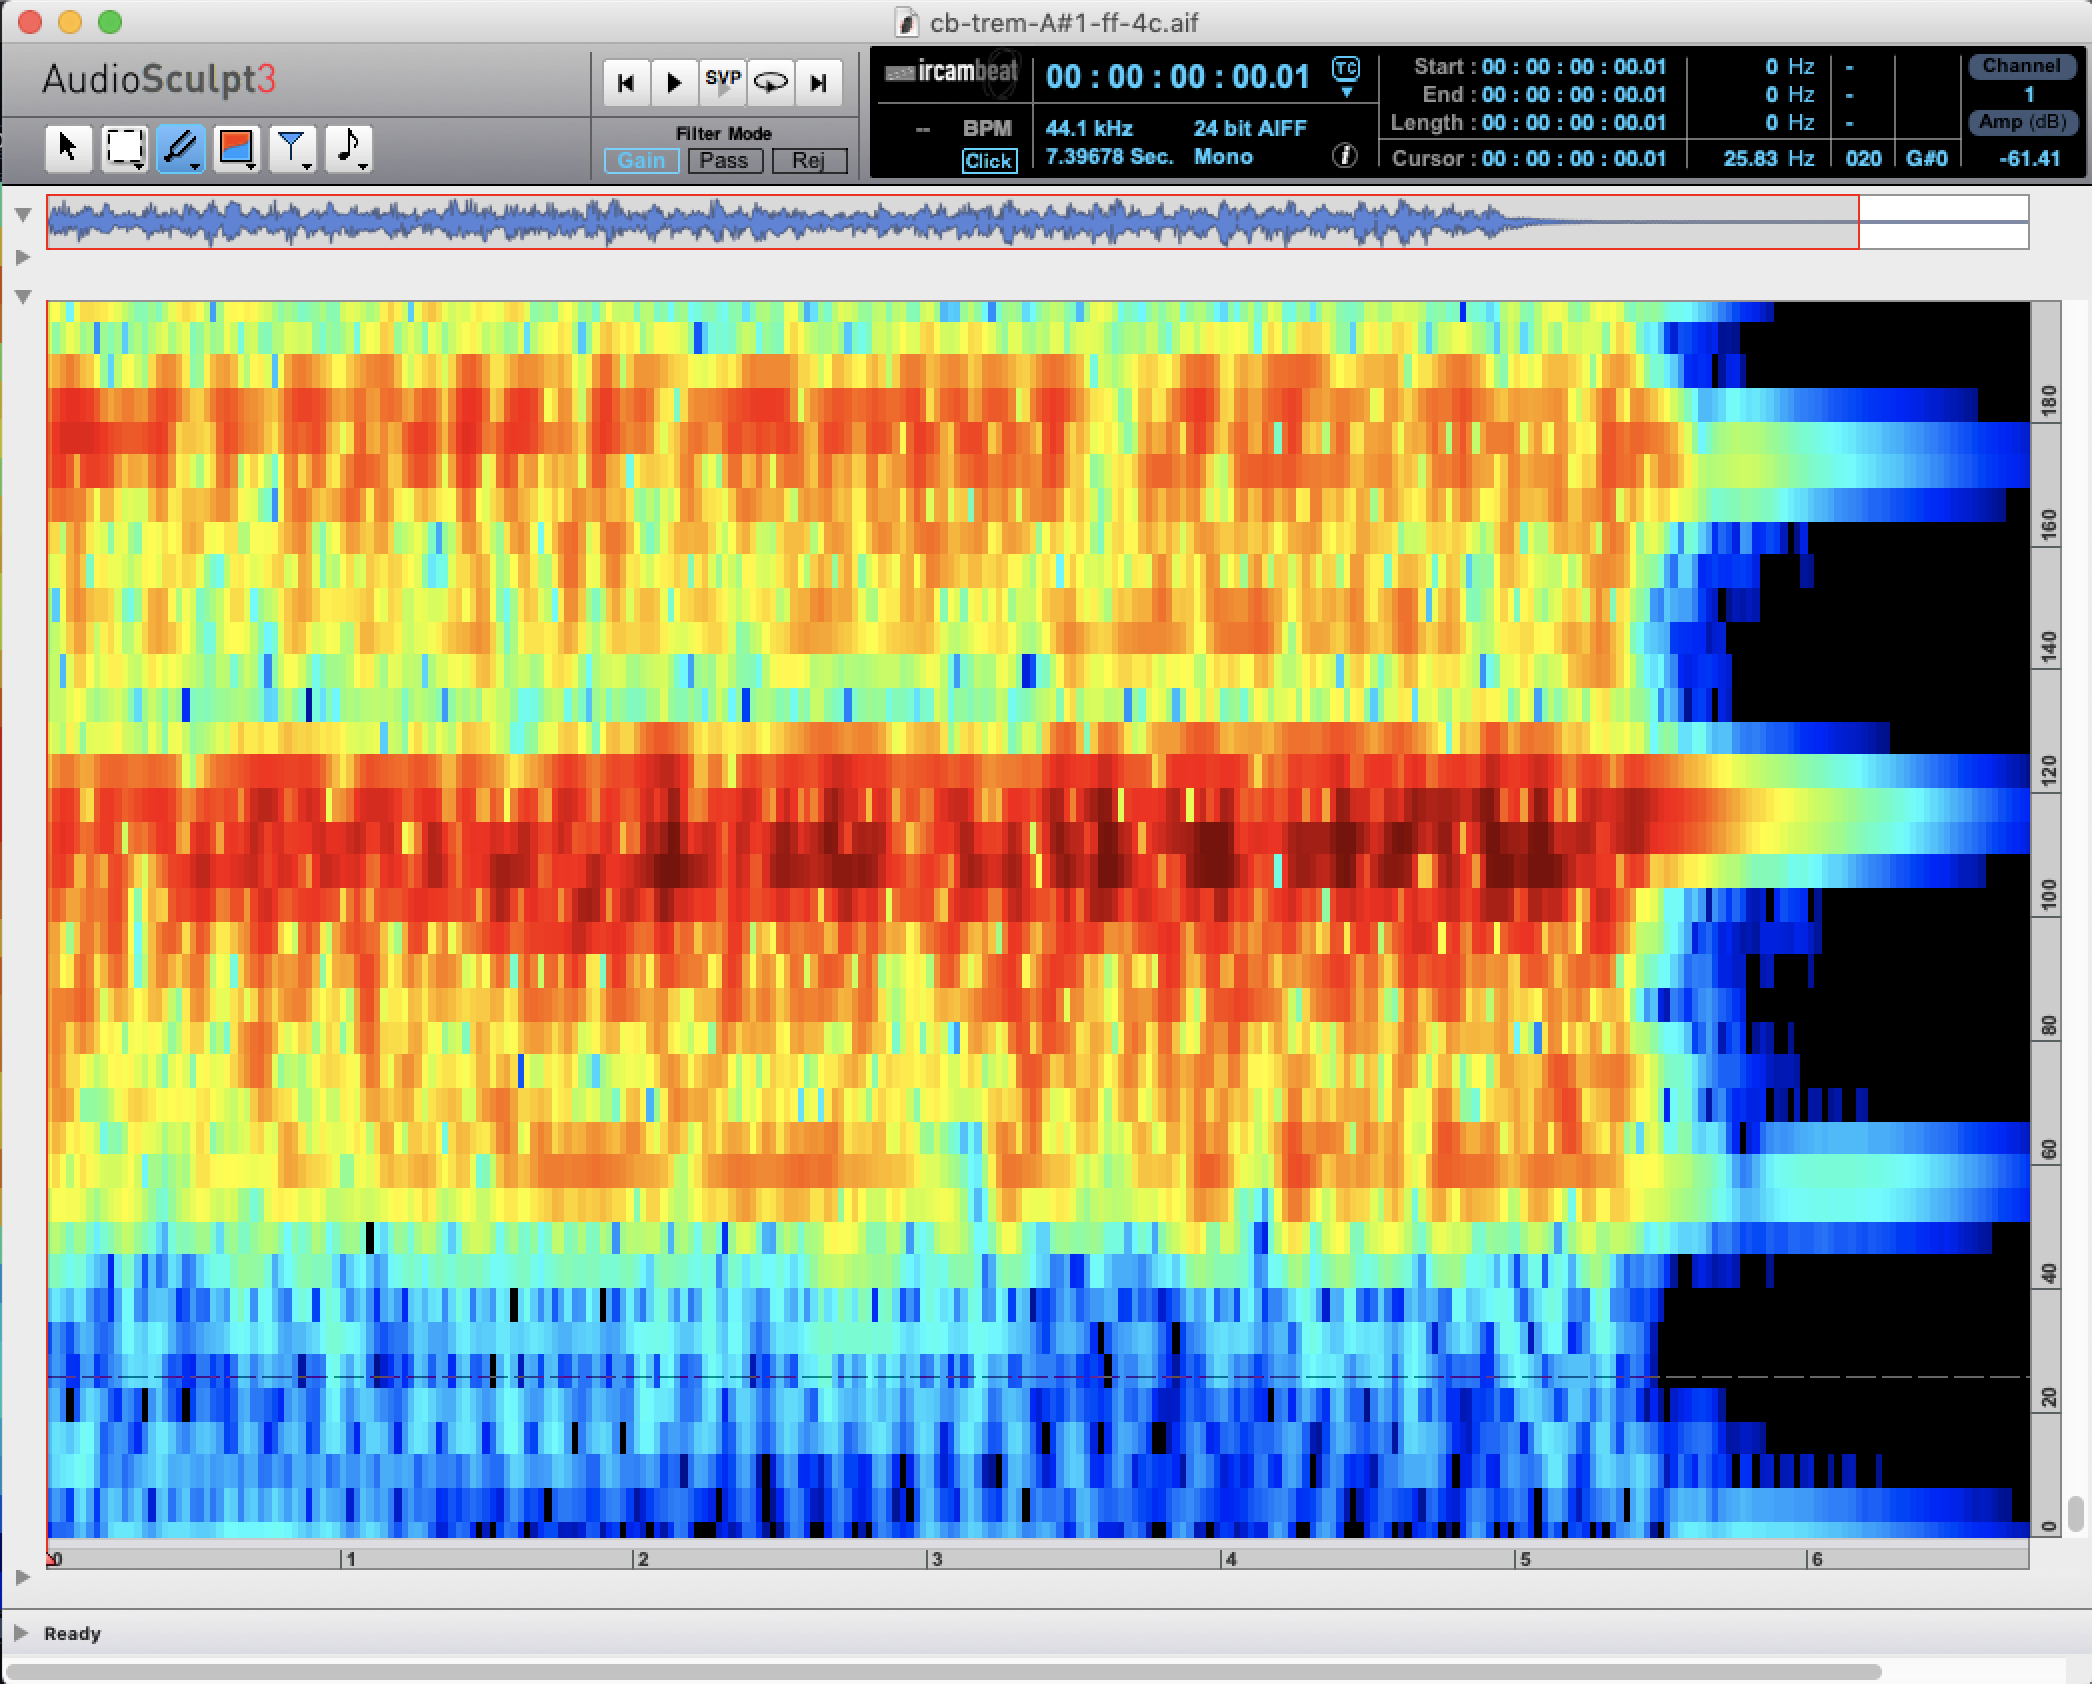
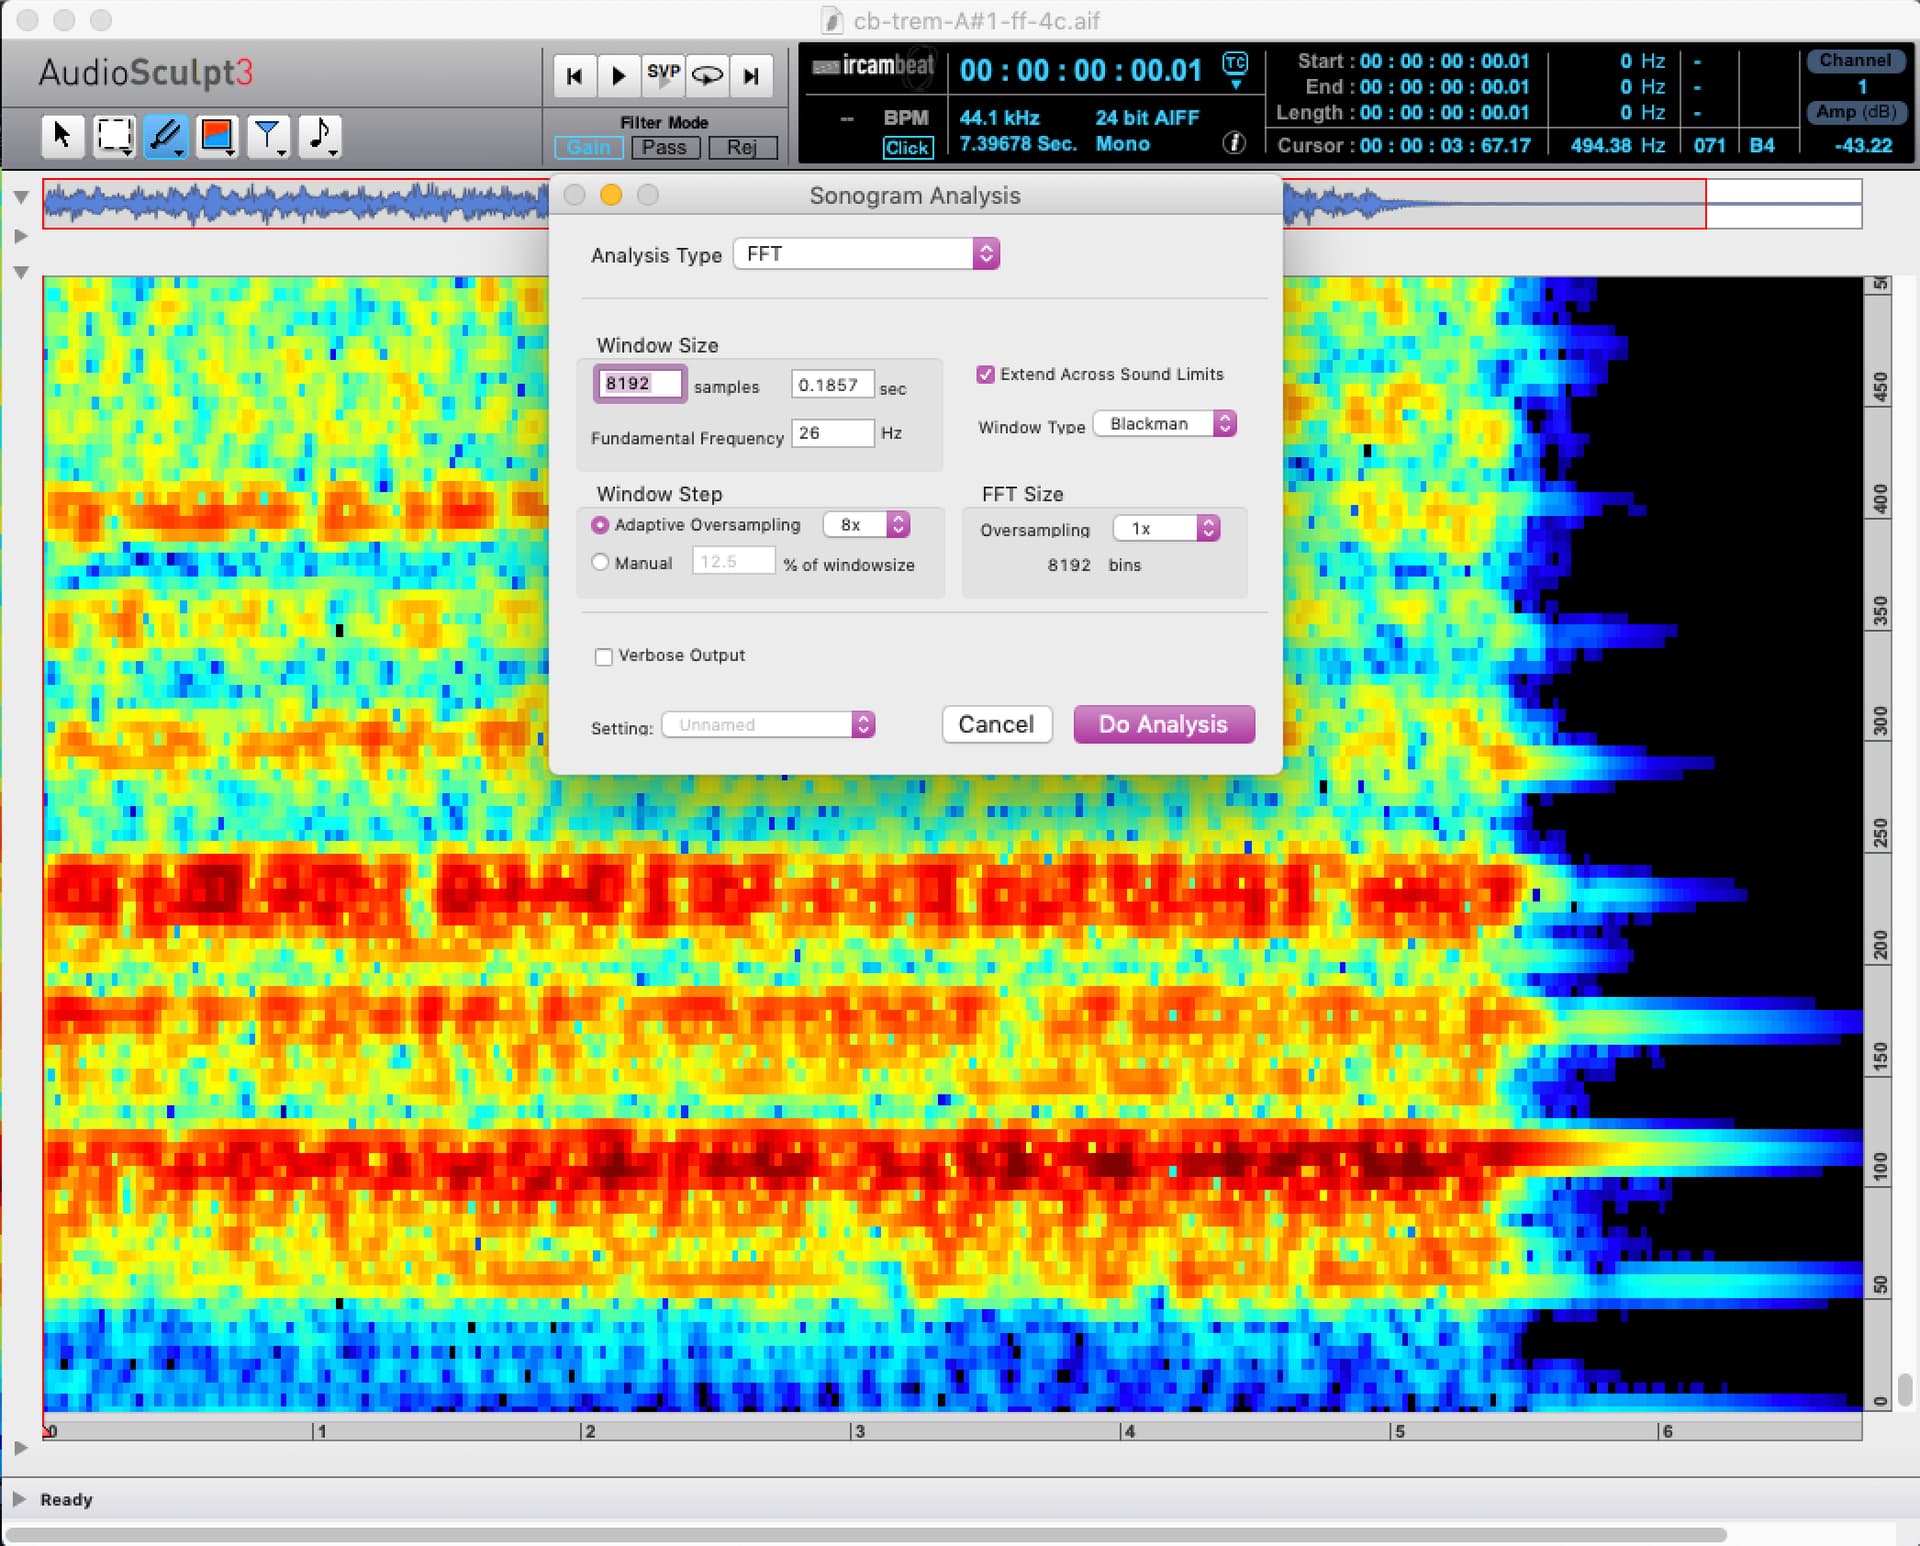
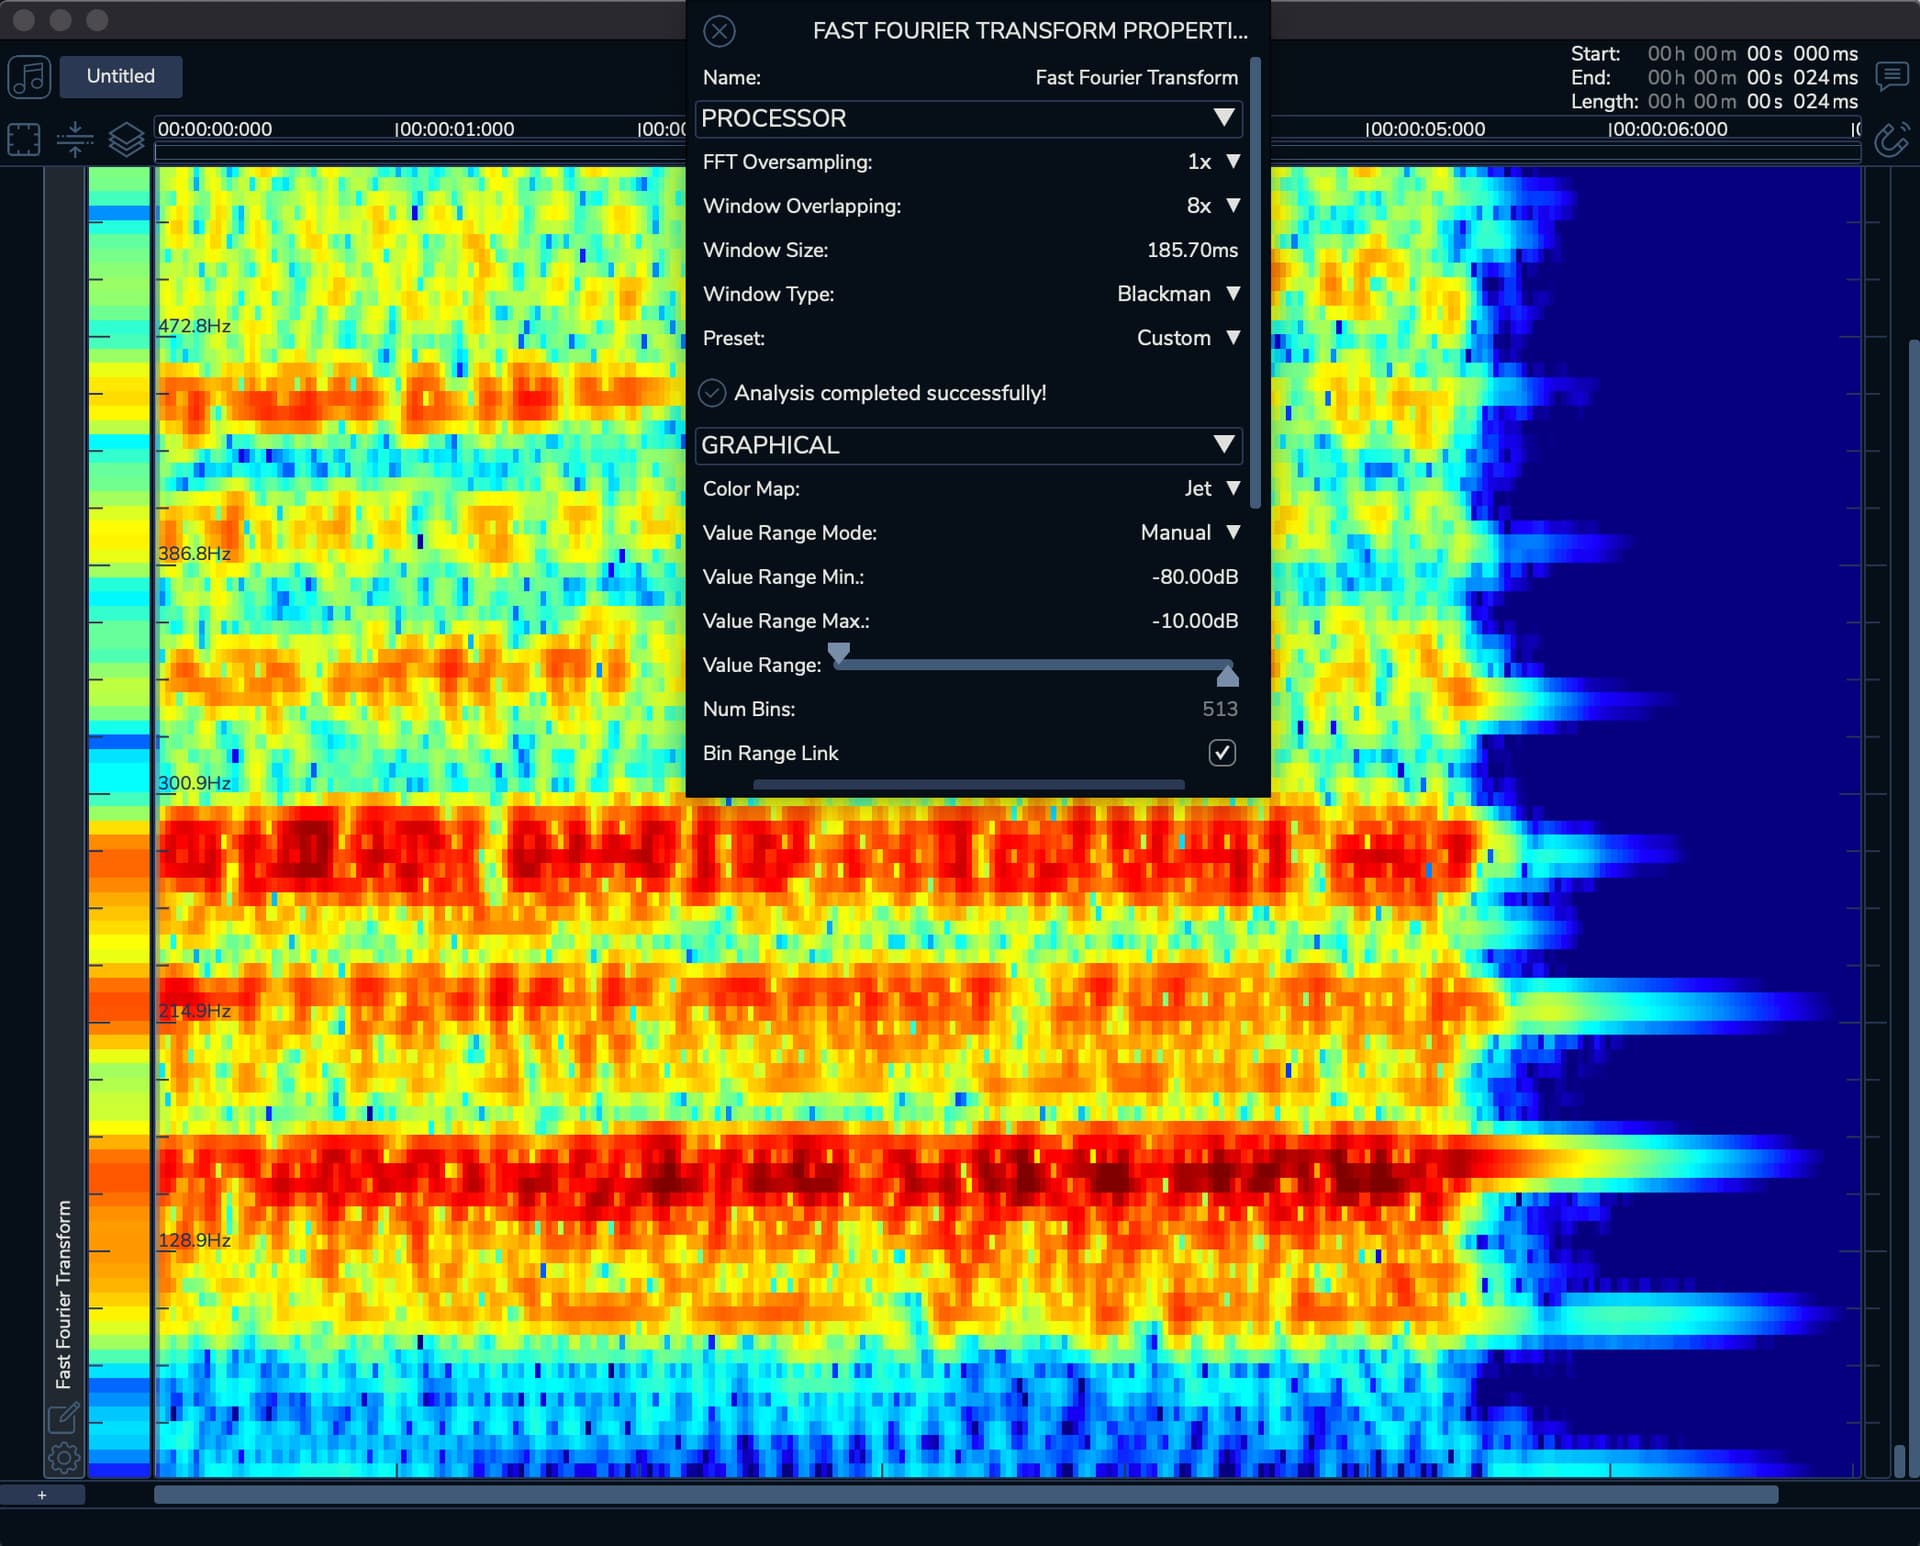
The sound was a A#1(approx. 58Hz) tremolo that I have already known. When I want to see the fundamental frequency, I notice that the lowest part of the spectrum with considerable energy stays around 86Hz and when I zoom in the values start to repeat. To make sure of the sound, I also analyzed it with AudioSculpt. There I found a very similar visual sonogram result but very in Partiel appears as 86Hz in AS shows 58Hz, as it actually should be. Is it because of the settings that I have to do in Partiels? Please find the screenshots and the sound attached.

Thank you very much for your help in advance.

Best regards,

Bengisu


cb-trem-A#1-ff-4c.aif (956.0 KB)

Hi Bengisu,

I am not sure, but it could be that it is related to the window/FFT size.

Best
K

Hello,

The analysis is good but it seems that there is a graphical bug with the vertical zoom because the number of bins is not well updated. The number of bins is 513 whereas the window size is around 8192 samples. That will be fixed!

For your information, Partiels doesn’t know that the spectrogram is really a spectrogram. As a Vamp host, it only knows that this is a grid (a matrix) with a specific number of columns and rows. That’s a limitation of the Vamp plugin system, I try to find a proper way to bypass it but I didn’t find it yet… But if you use an analysis such as fundamental frequency estimation (the feature scoring for instance), you will have a continuous vertical range so the grid will be much more adapted to a frequency representation (I use the ruler mode 1 in this case).

Thank you for the feedback!

1 Like

Thank you very much for the clarifying information, for your help, and for your work. I appreciate it very much.

Best regards,

Bengisu