Hello Nicholas
In AS you have peak analysis and partial analysis. Both create the analysis in SDIF format and should therefore be accessible in OM.
For peak analysis you can find the explanation here
http://support.ircam.fr/docs/AudioSculpt/3.0/co/Peak%20Detection.html
This one creates 1PIC sdif frames as described in the html doc. Here the only control over the result is the amplitude level and the maximum number of peaks per time position
For partial analysis (which is what spear does) here
http://support.ircam.fr/docs/AudioSculpt/3.0/co/Partial%20Tracking%20and%20Chord%20Sequence%20Analysis.html
With respect to partial analysis you have two variants - harmonic (you need to provide an F0 estimate for this case, and the peaks retained are only the harmonics) and inharmonic analysis (no need for F0 for this case, but yo get more peaks (that you can control according to amplitude and frequency position).
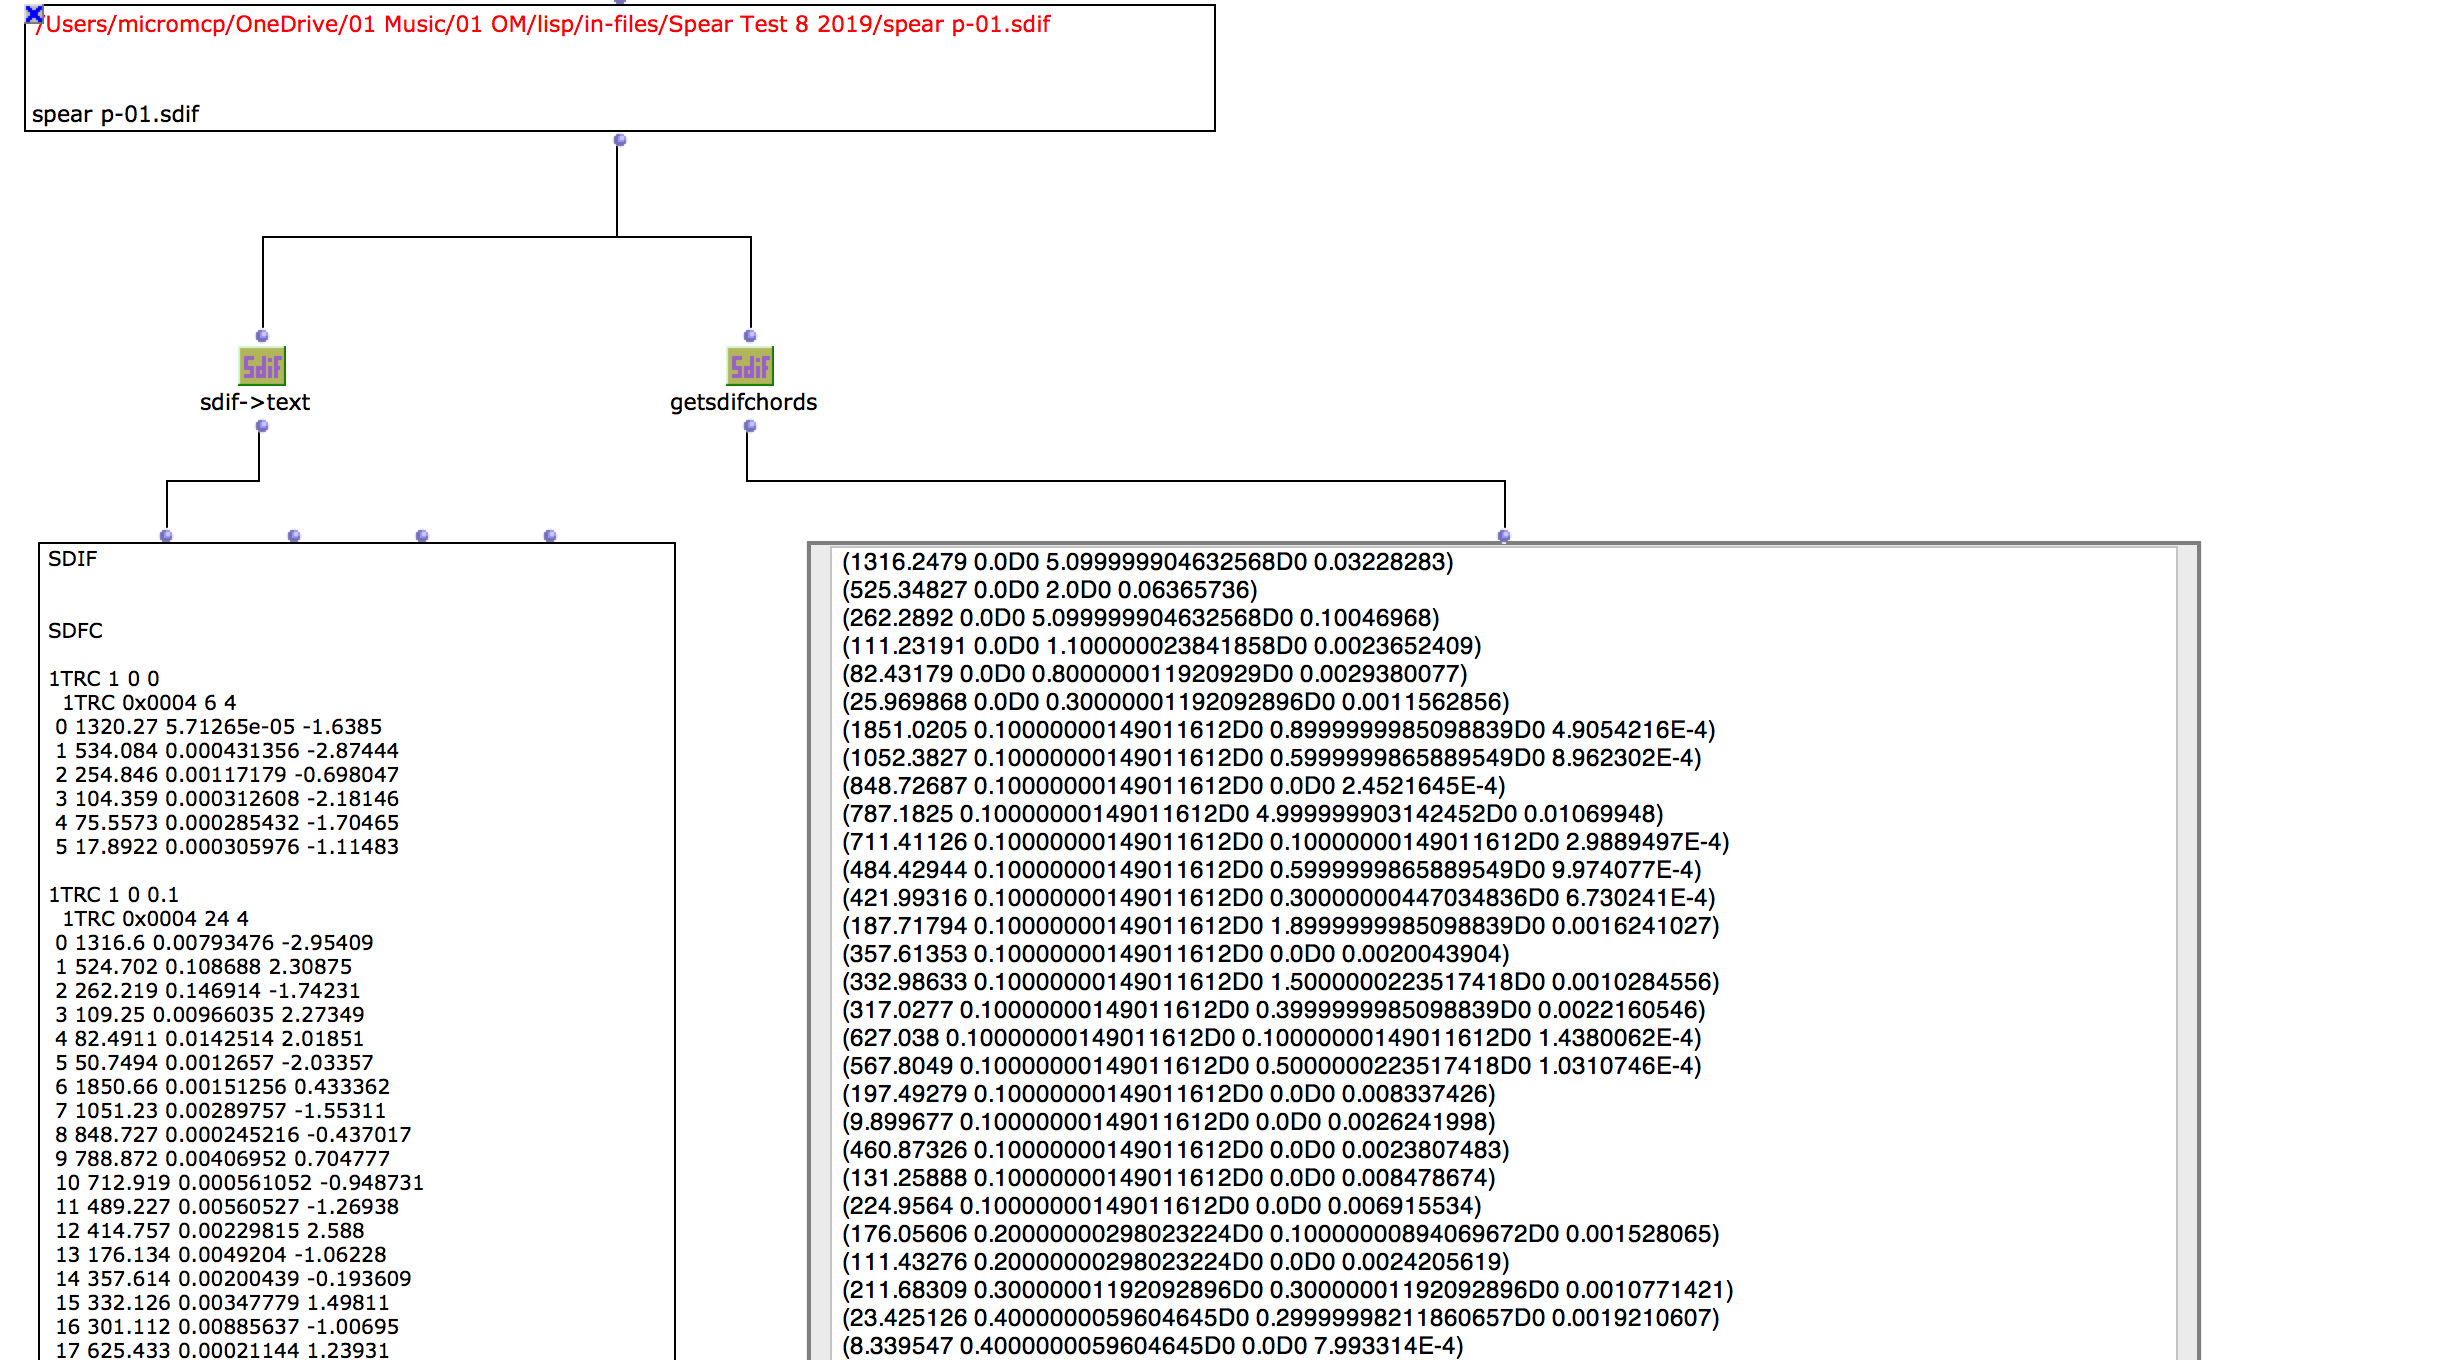
The first one creates 1HRM sdif frames with pics organized according to partial index. The second creates the 1TRC frames that you find in the above example from SPEAR. You see that pic frequencies are not ordered. This analysis is quite similar to peak analysis but subsequent peaks are connected to sinusoidal tracks and you can control which of the tracks you would like to retain during the analysis. For partial analysis AS shows the result on the spectrogram so you get a pretty good idea of the result. For peak analysis we don’t have any visual feedback.
Best
Axel