I’ve gone deep down the set-theory ̶B̶a̶b̶b̶i̶t̶t̶ rabbit hole and have been at work on implementing a concept introduced in Perspectives of New Music , SUMMER 2009, Vol. 47, No. 2 (SUMMER 2009), pp.
100-148 - More MOF and Mallalieu-related Rows (for those that are interested)
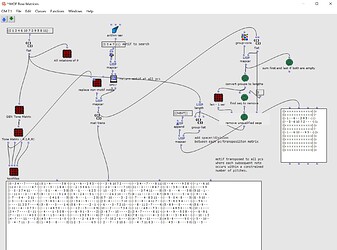
However, I am looking for information on better ways to visualize data in OM. Quite often I use it in a CAC format where I will work on a patch, generate data, and leave it on the screen as a sort of ‘scratch pad’ using the (in my case) displayed PCs and sets to improvise and work through ideas.
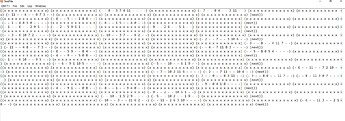
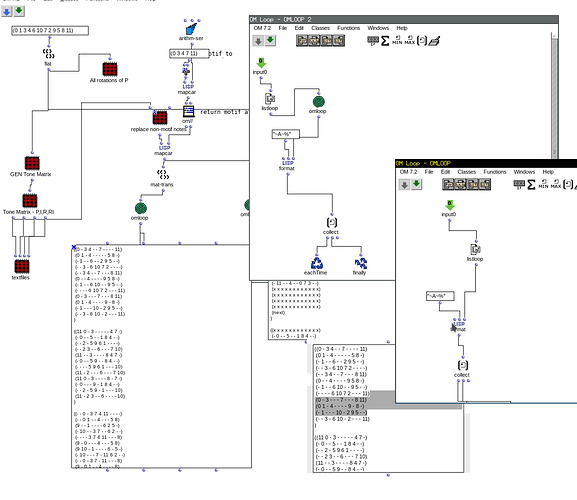
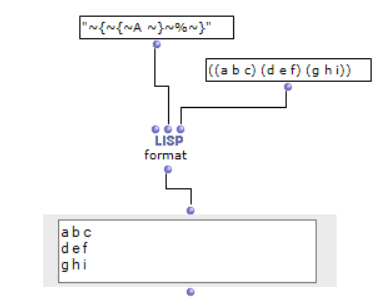
Several processes that I use and work on generate lots of data — and it just becomes unwieldy to view in a textfile. Both with the viewer (M key) and in the pop-out window (double-click). Are there better ways to view all of this created data? Preferably without exporting it to another file or saved file. One of the things I enjoy most about OM is how flexible it is. I can patch up an idea and be improvising with the generated data shortly after while also feeding my ideas back into the patch. This interactive and feedback-loop style of generating material is great!
I’ve attached the patch in question (It’s got a high spaghetti content, but I’ve done my best to clean it up.). Notice how both textfiles have to much data to display either in a stretched-out canvas object or in the pop-up window.
MOF Row Matrices.omp (59.3 KB)
Any thoughts? Am I too far gone down the theoretical void? ![]()


