< Back to IRCAM Forum

"amplitude" format in AS?

Hi

Exporting SDIF analyses in text form with AS, I wonder what is the format for Amplitude? There are all values between 0.000000 and 0.001xxx.
Thx

Bonjour

J’aimerais savoir quel est le format adopté pour la transcription des amplitudes quand on exporte un fichier SDIF d’une analyse au format texte. Ce sont des valeurs comprises entre 0.000000 et 0.001xxxx.
Merci

Hello MUS3,

this depends on which analysis you are looking at, is it FFT analysis (spectrogram) or partials, or may be F0?

Best
Axel

Axel

They are partials calculated by “Chord Sequence Analysis”. The amplitude threshold is “linked to sonogram”. (For the file I am working, it means -77 dB).

Thanks!

Didier

Axel

Must I consider you answered through the other topic “analyse des partiels”? I read it but not exactly understood the relation betw. dB and Audioculpt exported values. I join here the text file produced exporting Chord Seq. analysis by AS. Note that although I checked to export only Time, Freq. and Amp, the file exported all the five SDIF data (is this a bug?).

Best

Didier

Bee_Symph5_trans3a4ExportedChordSeq-TimeFqAmp.txt (32.1 KB)

Hi MUS3

...Note that although I checked to export only Time, Freq. and Amp, the file exported all the five SDIF data (is this a bug?)...

In SDIFConverter, You need to check the Custom Format option (checkbox) in order to get the correct order of columns as you specified it using the menus. Otherwise it seems like it does export the SDIF data as it was written initially.

Best,
Charles

Hi MUS3

sorry for the slight delay, I was busy with other things.

indeed the reply is the same as in the other thread. But in case of chord sequence analysis, where partial parameters are fixed the resynth
formula is simpler:

s(n) = A sin(2 pi F/R + P)

that is the amplitude of your analysis is A, the frequency F, R is again the sample rate, and P is the phase.

I read it but not exactly understood the relation betw. dB and AudioSculpt exported values.

The db slider filters partials with amplitude below xx db (-77 in your case)
To convert the A parameter you get into db you can use this formula

A_dB = 20*log10(A)

or the other way around

10^(A_dB/20) = A

For your setup with amplitude filter set to -77dB spectral peaks having amplitude smaller than
-77dB = 0.0001412537 will not be taken into account. This limits the amplitudes you will have in your result, but according to the settings
you use for the partial analysis.

If you really used -77db as filter in your analysis then your results seem to contain amplitude values slightly below the limit.
I don’t understand exactly how you did your analysis, so I don’t see where this comes from. If this disturbes you please send me your sound and the command line that you find in the AS command window, so that I can see what is the reason.

Best
Axel

Thanks Charles for the tip for SDIF Converter. I understand now that it simply makes a rounding of the written values of the SDIF.

But my question remains. what format SDIF writtens amplitudes? As AS amplitude parameter programming is expressed in dBs FS (from -x up to 0), I expected the same for the results.
When I get amplitudes from a sdif files, (by “getsdifdata” in OpenMusic), I get:

(((0.005390365142375231D0) (0.002509040292352438D0) (0.0015985973877832294D0) (0.0015686744591221214D0) (6.1449920758605D-4) (6.887501222081482D-4) (5.887052975594997D-4) (3.0439504189416766D-4) (2.998748095706105D-4) (2.033797063631937D-4) (1.78046670043841D-4) (1.6308670456055552D-4)) ((0.00792629737406969D0) (0.0048147691413760185D0) (0.0035679431166499853D0) (0.004306610208004713D0) (0.0031704946886748076D0) (0.005726358853280544D0) (0.0015486773336306215D0) (9.042499586939812D-4) …

Are they dBu, dBm …?

Didier

Hi MUS3

But my question remains. what format SDIF writtens amplitudes? As AS amplitude parameter programming is expressed in dBs FS (from -x up to 0), I expected the same for the results.
I have explained meaning of the amplitude, frequency and phase parameters that you find in the sdif analysis.
Now, you are obviously free to follow your expectations and try to interpret sdif partial amplitude values in dB.
But please don’t expect any sensible results, because this is not correct.

With respect to the choices:
db scale is good for visualization, and that’s why the spectrogram is displayed in dB, and therefore as well
amplitude control is in db.

Partial parameters are primary for synthesis and representing them in dB would require unnecessary conversion. Therefore, they are stored in linear amplitude. BTW, the sdif format is standardized, and requires amplitudes of partials to be linear.

Best
Axel

Ah yes, SDIFConverter seems to export a fixed precision, rounded to 6 decimal places. That should be probably modified.

Gain amplitude is always written ranging from 0 to 1 (in SDIF or any other format that specify its output as gain amplitude) and may be expressed in dBFS as Axel explained you in this previous post related to the conversion (http://forumnet.ircam.fr/user-groups/audiosculpt/forum/topic/amplitude-format-in-as/#post-7379).

I think the results you have from the Pm2 getsdifdata are expressed as gain amplitude (and if the format description of your SDIF data tells you so).

You need to convert those numbers to get dbFS => FullScale, wich is relevant for audio numerical signals/data

HTH

Best,
Charles

Thanks a lot Axel and Charles

Your answers help well!
I don’t want nor need to convert data to dB FS, I only need to know the format and/or formula which give that values. Thanks Axel for the tip.

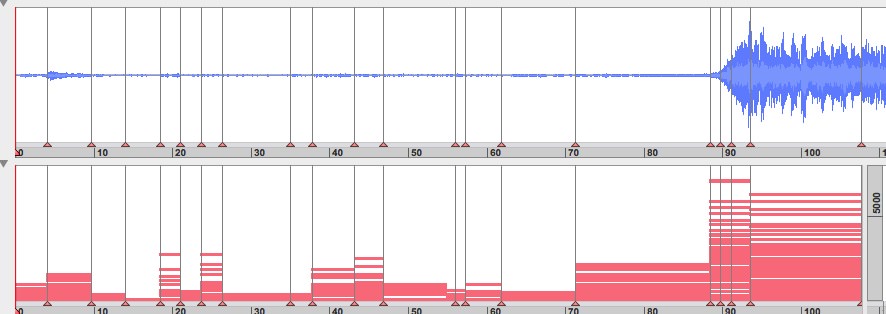
But, Charles, if range is from 0 to 1, why do I get only values that low (0.001…)? My file contains some quite loud instants. See pictures joined (the 2d is after the sdif file). Is that something to do with the option “link to sonogram” threshold?

BTW, the excerpt is the transition from the end of 3rd movement to the beginning of 4th movement of Beethoven’s 5th symphony.

Best

Didier

Bee-5-trans-markers chordseq amp.jpg

Hi Didier,

to have an idea of the amplitudes you should get, please create a spectrogram, open the instantaneous spectrum, clic into the sound where you want to investigate and read the amplitudes of the peaks in the instantaneous spectrum. These you can convert to linear amplitudes using the formula I gave you.

Amplitudes of the sinusoids representing a sound depend on the sounds amplitude and the bandwidth. If the bandwidth is larger there are moire sinusoids that all contribute to the overall amplitude and for the same peal sound amplitude the sinusoids have therefore to be smaller.

For your sound the amplitudes are smaller in beginning because the sounds amplitude is smaller, the are larger in the end (up to at least 0.02) because the sound is stronger there. If you have partial amplitude of 0.02 for more than 50 partials you get into clipping. But obviously sound energy for music decreases generally with frequency. So the relations are complicated, but can be understood with the analysis provided in AudioSculpt.

Best
Axel

As a dummy practical example you will get a single partial result with a gain amplitude around 1.0 if you perform a partial/chord seq analysis on a single sinusoid at 440Hz generated at 0dBFS.

(0.000000 6.687347 440.125458 1.009612 -0.810017)

:wink:

Best,
Charles

Thank you both for this tutorial! All topic saved … :slight_smile: