about treatments - Spectral BreakPoint Filter
What command can we use to fit the Spectral curve , instead of drawing all the points
along the curve…!!! Really for an FFT of size 2048 it’s 1024 points… ?
Best regards.

about treatments - Spectral BreakPoint Filter
What command can we use to fit the Spectral curve , instead of drawing all the points
along the curve…!!! Really for an FFT of size 2048 it’s 1024 points… ?
Best regards.
Hi,
I don’t quite understand yor question. There is no fitting possible in AS, this is a graphical interface for drawing.
So you cannot fit anything. That said there are a few things that may help you understanding the filter and also help
you using these filters (see point three for fitting):
The idea that you need to adjust all points of an FFT individually is a completly misunderstanding. The filter is presented as a breakpoint function
and you can insert as many points as needed for your filter, then the bins between these breakpoints are linearly interpolated. For most cases you don’t need many points.
Due to the frequency resolution that is inherently constraint by the analysis window you use, there is no way to independently control all bin. Because the analysis windo can be controled independetly of the bpfilter, there it is impossible to automatcially adapt the filter to the settings. Also, in reality the relations are highly complex and depend on the break point positions and the related values. For a standard window and FFT oversampling of 1 you can at best set contrl a grid of points that are separted by about 5 bins each. Even this however will not create a filter that allow you to achieve arbitrary changes between neighboring points, the effective filter will always be smoothed with the frequency spectrum of the analysis window. All these are fundamental relations that are related to the time and frequency resolution of the analysis/synthesis procedure that is performed in the phase vocoder.
Finally, if you right click on the bpf editor you can copy the current list of bpfs and paste them into a text editor, there you see the specification is of the form
frequency, attenuation, as for example:
0.000000000000000 0.000000000000000
126.227112310731911 -32.551999999999992
324.584003084739209 -35.479999999999990
396.713781548014538 -46.215999999999994
841.514082071545999 -54.999999999999993
1009.816898485855290 -57.439999999999998
2000 -10
The bpf is always extrapolated to the spectral boundary values (O, samplerate/2) as constants, so in the bpf I pasted above all frequencies above 2000Hz
are attenudated by 10dB
Further, in the bpf editor menu you also find an import option that allows you importing break point functions that you may create with external software.
So you could for example use numpy/scipy to create a bpf that you fit to whatver you may want to fit to and then import those into the
bpf editor.
Hope this helps
Best
Axel
Thank for your reply, Axel.
In fact my goal was to extend ( prolongé) a background_noise from 1 second to 20 second.
The idea was to use a WAV file with my background_noise from 0 to 1 second and after, 20 second of WHITE NOISE.
Then using my_background_noise to do a FILTER ( with the Spectral BreakPointFilter) in order to FILTER the WHITE NOISE.
I was thinking of the Spectral BreakPointFilter as a simple Multiplier of BIN… But if I understand well your answer : FILTER is Time domain,
a MULTIPLIER ( or another term) is for FREQUENCIES domain.
Yes , numpy/scipy , would be alright . I think the median would be better then the mean in that case: with AS I did sort the sinusoid only and the noise only and it’s like , from the new sonograms, 99% noise and 1% sinusoid_chirp.
Best.
Hi QCMV22
a few further comments.
First considering the BPF: I don’t quite understand what made you think the filter would not be a bin multiplier. Yes indeed, it is a “bin multiplier”,
but due to the frequency resolution of the treatment even if you set an individual bin to zero, and then you synthesize and you look again into the spectrum of the result you will find that the bin you set to zero will not have zero amplitude! This is because you can create STFT spectra that do not correspond to a real sound (and this is the case if you set an individual bin to 0). and the synthesis will find the most appropriate compromise.
Then considering your comment on the median…
The window you observe in the spectrum window where you draw the BPF displays the magnitude of the instantaneous spectrum, for noise signals this magnitude as a certain distribution that is called Rayleigh distribution,
and this distribution has a scale parameter “s” that is linked to the amplitude (the energy of the noise). In fact whether you use median or mean is more or less the same. In both cases there exists a fixed relation between s and media/mean. So if you fit your filter by means of relating two real world sounds will be the same, and additionnally the filter that comes out is by construction a filter that will produce realizable sounds, so that the problem of the resolution I discussed above is no problem here.
Now for noise background with rather soft spectral changes I’d say that by simply visually inspecting the noise signals in the spectrum window of AS should give you a pretty good idea what amplifying factor you need (because your visual averaging takes something that similar to media and mean will have a rather constant ration to the scale parameter s of the distribution) and so with a few break points you may already become sufficiently precise to be able to adapt your white noise, besides if the noise spectrum changes its magnitude very quickly in which case the numpy approach would probably be much better.
Best
Axel
HI Axel, my last reply on that subject.
I did the spectra analysis with AUDACITY with the same FFT size to see what it’s look with all the bins .
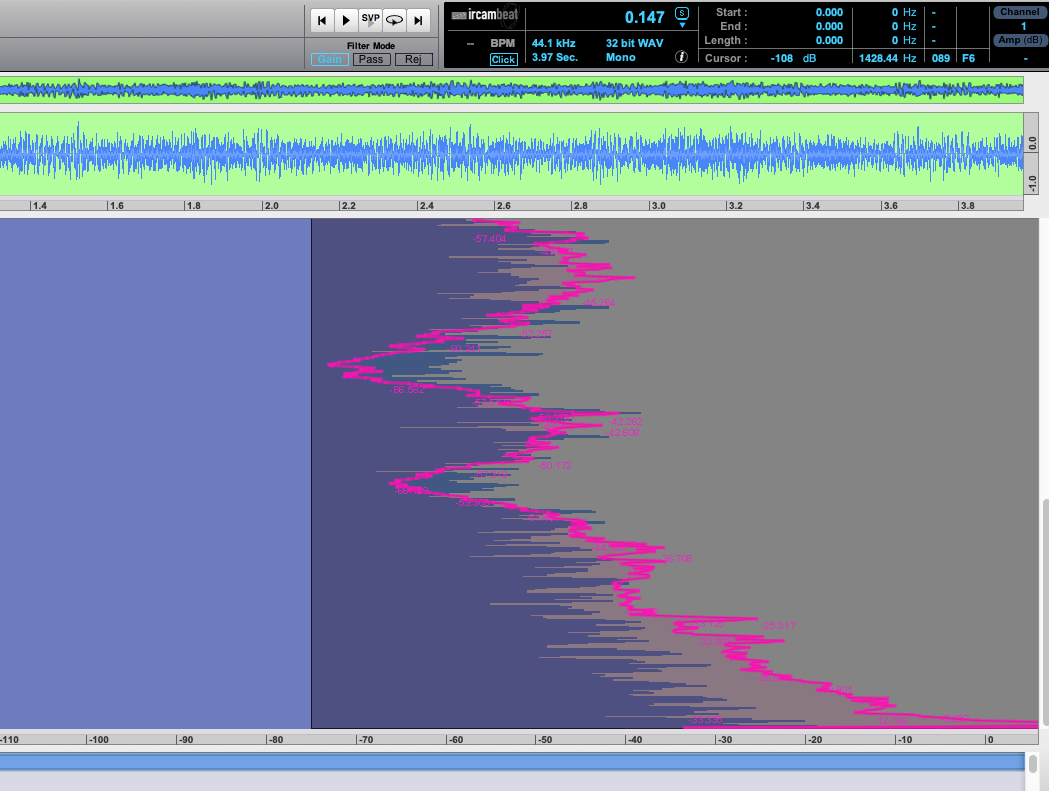
So as you can see on the Screenshot ( capture1.png ) AUDACITY seems more like the mean of all the frames
and AS look more like an Instant Spectrum - your last reply.
Also AS do the Parabolic interpolation of the frequencies and now I understand your first reply.
===== AudioSculpt BPF by copy of drawing FFT size 2048
0.000000000000000 -36.400643604183429
42.042040769203481 -23.569311246730592
135.800493802070520 -15.691069991954947 —> parabolic interpolation for frequencies with AS
271.600987604141039 -32.278358809332261
311.542309310632334 -28.941271118262264
351.483631017123685 -38.756234915526946
407.401481406211531 -25.800482703137575
487.284124819194176 -43.271118262268701
623.084618621264667 -25.702333065164922
726.932055058142168 -47.197103781174576
798.826434129826566 -29.726468222043437
878.709077542809155 -41.995172968624303
1014.509571344879646 -34.045052292839898
same spectrum with AUDACITY
21.533203 -40.667503
43.066406 -26.643507
64.59961 -19.92106
86.13281 -19.929636
107.666016 -20.42025
129.19922 -20.074167 —> NO parabolic interpolation freq = float(bin)*21.5332 (44100/2048) ok if it for NOISE only
150.73242 -22.212538
172.26562 -24.369339
193.79883 -25.231997
215.33203 -26.2828
236.86523 -27.372082
258.39844 -27.641865
279.93164 -28.01699
301.46484 -30.399153
322.99805 -31.170221
344.53125 -30.65723
(…)
Read by AS in the BPF editor and reWRITE by AS
0.104675240814686 0.000000000000000
21.533203000000000 -40.667503000000004
43.066406000000001 -26.643507000000000
64.599609999999998 -19.921060000000001
86.132810000000006 -19.929635999999999
107.666015999999999 -20.420249999999999
129.199219999999997 -20.074166999999999
150.732419999999991 -22.212537999999999
172.265620000000013 -24.369339000000000
193.798830000000009 -25.231997000000000
215.332030000000003 -26.282800000000002
236.865229999999997 -27.372081999999999
258.398439999999994 -27.641864999999999
279.931640000000016 -28.016990000000000
301.464839999999981 -30.399152999999998
322.998049999999978 -31.170221000000002
344.531250000000000 -30.657229999999998
366.064450000000022 -30.632995999999999
(…)
Best.
nota about MacOS Mojave and TextEdit :
AS cannot read the Audacity file because there is no .txt extension, and if you copy to TextEdit you cannot
save it with the extension .txt or if you find a way - you will not be able to open it with AS or any other software.
You need something like a LINUX (Ubuntu) GEDIT editor but for MAC OS .
I did a small app in Processing (.org) for that purpose when I updated to MOJAVE.
Hi,
I don’t know if pertinent, I apologize if not. I must first premise I am still working on OsX 10.8.5: once I had a similar problem with textedit about saving in pure text format. In my textedit version there is a menu voice that permit to convert the document in text format (I hope also in your version, it is into menu “Format”), and it should be readable by AS, if I remember good. Once the document is converted into text format it can be saved with .txt extension and recognized as such. I hope this can be useful.
Best
fdsdb
Hi QCMV22,
Sorry to jump into this conversation, but as FDSBD mentioned you have several options to convert your content in TextEdit in standard text.
First, TextEdit opens a document in either RTF or TXT, you can set this option in the Preferences of TextEdit and choose to work by default in Text (if you prefer).
Then, say you work by default in RTF, you have also the option to change the format to TXT under the menu Format > Convert To Text (the inverse is also possible if you work in text format by default and want to change it to RTF).
If you have no particular reason to work with RTF, i would suggest you to change the format preference directly in TextEdit and set it to Text mode by default, so that problem won’t bother you anymore, and if you wish to then use RTF, you convert it using the option in the Format menu, very easy to do.
It is perfectly possible to manage those issues by changing those options in TextEdit, i do that all the time. Those options have been there for a long time now, i am not in Mojave so i cannot tell for this system.
Once you set the format to text you can copy/paste very easily from/to AudioSculpt so if you intend to use Audacity to setup the breakpoint filter bpf points this is definitely possible.
(A third option would be to use another editor, like for example Sublime Text in Mac, but you can really do all this with TextEdit if you want to stick, with it, and you do not need to create a Processing app for that.)
HTH
Best regards,
Charles
Hello QCMV22,
in addition to the two comments given before, I would like to mention that their exist numerous free TXT editors for MacOS.
Here a list
Besides that,
I did the spectra analysis with AUDACITY with the same FFT size to see what it’s look with all the bins .
I don’t understand this, there was never any mention that AS does not make a spectrum analysis of all bins, obviously though, if you have only 500 pixels, you cannot display 1025 spectral bins, so the graphical display will not display all the bins.
So as you can see on the Screenshot ( capture1.png ) AUDACITY seems more like the mean of all the frames
and AS look more like an Instant Spectrum – your last reply.
See here
https://manual.audacityteam.org/man/plot_spectrum.html
it states that AUDACITY calculates the average spectrum.
Also AS do the Parabolic interpolation of the frequencies and now I understand your first reply.
Hm, I am not aware of any parabolic interpolation in AS, but, as I mentioned above displaying the spectrum with
a limited number of pixels will give you a drawing grid that is not aligned with the bins. The grid you display in your screenshot is not regular so you probably also did not draw all points you saw. In fact, AS allows oyu to draw with arbirary precision,
you can zoom into frequency and put points with more procesion than the bins. This is, because even if you display your spectrim with an FFT size of 2048, you may operate the treatment with FFT size = 8192. So drawing cannot rely on the FFT size you chose for displaying your spectrum.
Finally, there is the import function, that allows you to import with precise frequency locations. If I understand correctly you did that in your second test and the results are as expected.
All the best
Axel